Ependymoma Statistics
How often do ependymomas occur?
Numbers result from the collaborative work of two groups: The Collaborative Ependymoma Research Network (CERN) Foundation and Central Brain Tumor Registry of the United States (CBTRUS). The data is pulled from the 2015 published report called CBTRUS Statistical Report on Primary Brain and Central Nervous System Tumors Diagnosed in the United States in 2008-2012.
What is CBTRUS?
CBTRUS is a not-for profit research corporation. Its mission is to gather and spread current epidemiologic data on all primary brain and central nervous system (CNS) tumors. This lets people see incidence and survival patterns, evaluate diagnosis and treatment, facilitate etiologic studies, establish awareness of the disease, and ultimately, prevent brain tumors.
Statistical Definitions
- Incidence: The occurrence of newly diagnosed disease that appears in a particular population during a specified period of time (typically yearly). In this report, the crude incidence rates are calculated by counting the number of people with newly diagnosed primary brain and CNS tumors and dividing by the total population at risk (e.g. the total population in a state or collection of states) and are usually expressed per 100,000 persons. Incidence rates can also be calculated specifically for those diagnosed with ependymoma.
- Age-adjustment: Age-adjustment is a procedure designed to minimize the effects of differences in age composition when comparing incidence and mortality rates among different populations. Age-adjustment of rates in this report is calculated by the direct method adjusting to the 2000 U.S. standard million population.
- Prevalence: The number or proportion of people with a particular disease or attribute (in this case, both those with a newly diagnosed brain or CNS tumor and those who may have been diagnosed in the past and are living with the disease) in a given population at a specific time.
- 5-year survival rate: The probability that a patient will survive for 5 years from the date of diagnosis of a disease (in this case, diagnosis of a brain or CNS tumor).
Incidence of Primary Brain or CNS Tumors
For all primary brain and CNS tumors, CBTRUS estimates that the average annual age-adjusted incidence rate is 28.57 cases per 100,000 persons for the years 2008-2012.
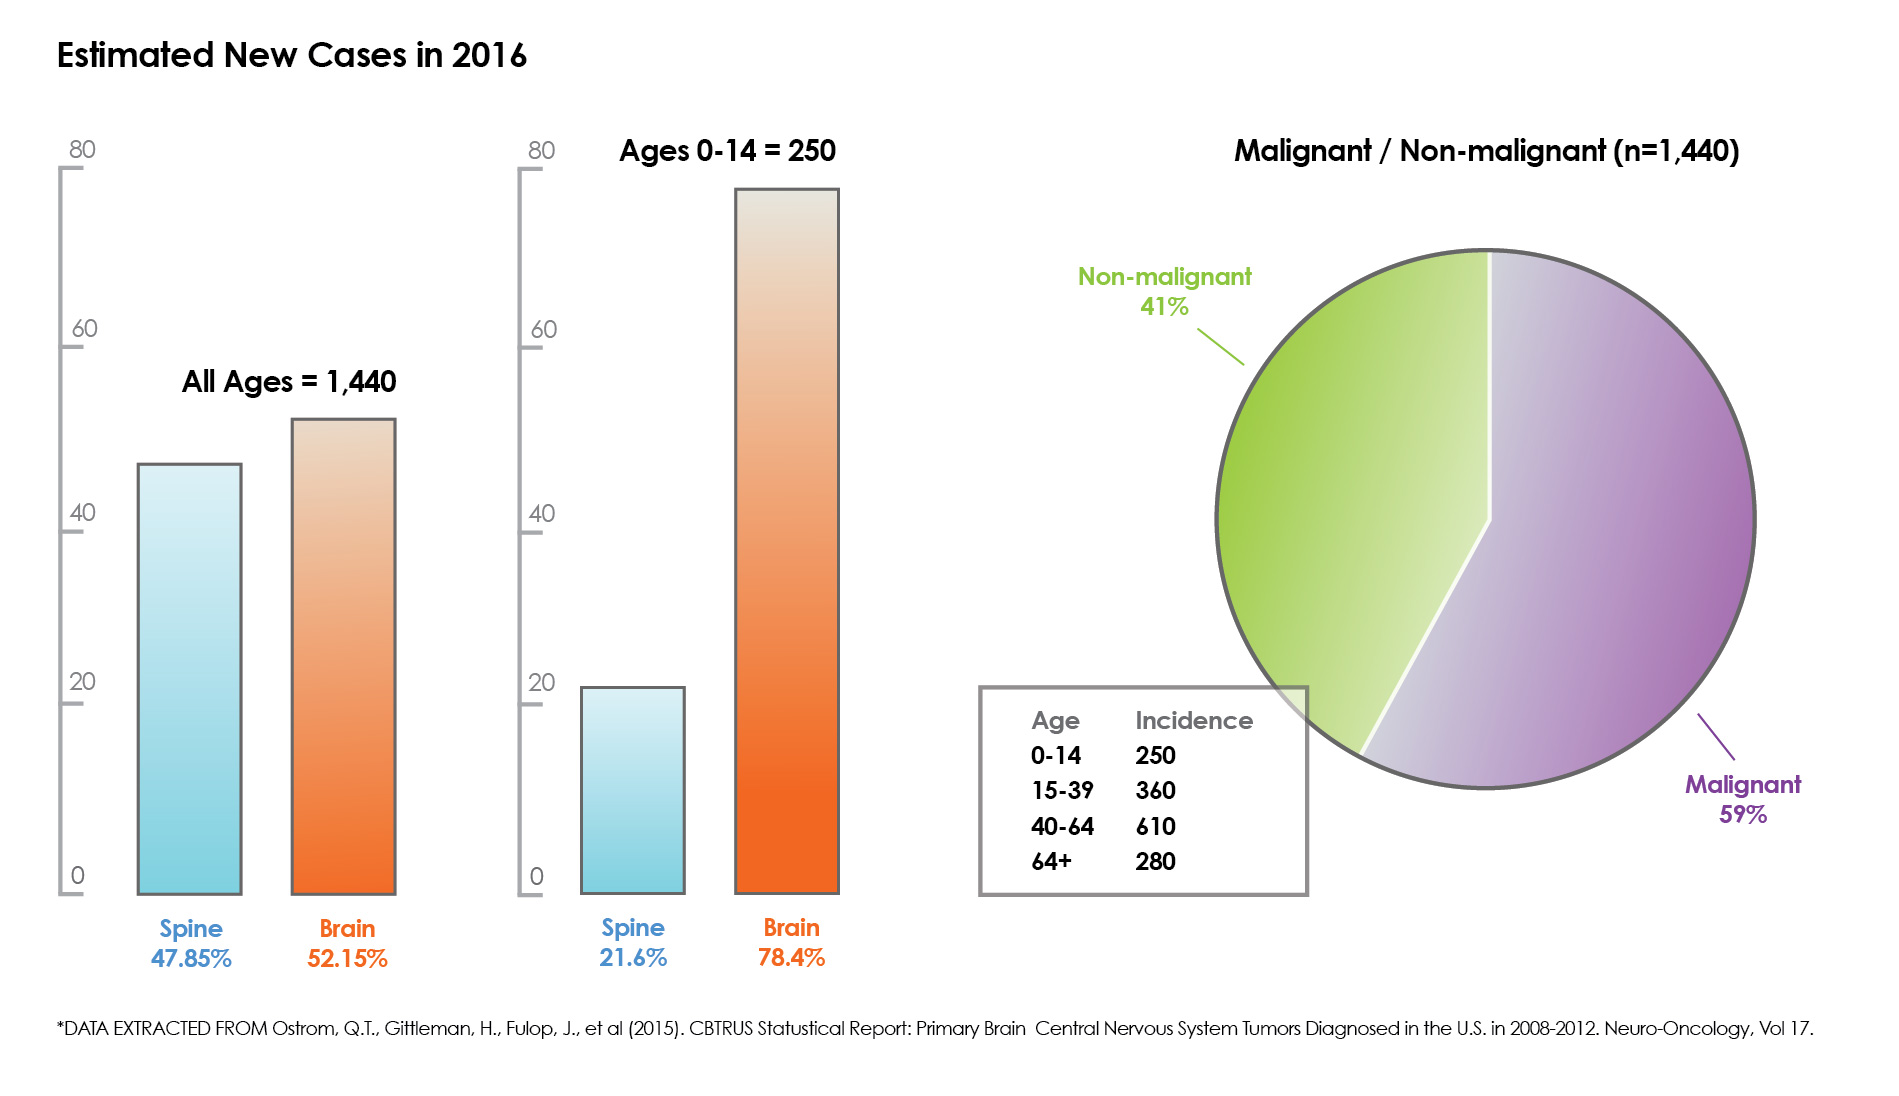
An estimated 77,670 new cases of primary brain and other CNS tumors are expected to be diagnosed in the U.S. in 2016.
For all primary brain and central nervous system tumors, the incidence rate is 21.97 cases per 100,000 person-years. An estimated 4,630 new cases of childhood primary brain and other CNS tumors are expected to be diagnosed in the U.S. in 2016. Ependymomas (ependymoma, NOS (not otherwise specified), epithelial ependymoma, cellular ependymoma, clear cell ependymoma, tanycytic ependymoma, anaplastic ependymoma, ependymoblastoma) and ependymoma variants (myxopapillary ependymoma) are rare, and represent 1.9% of all primary brain and CNS tumors.
Approximately 1,340 ependymomas and ependymoma variants are diagnosed per year.
Adults (> 19 years):
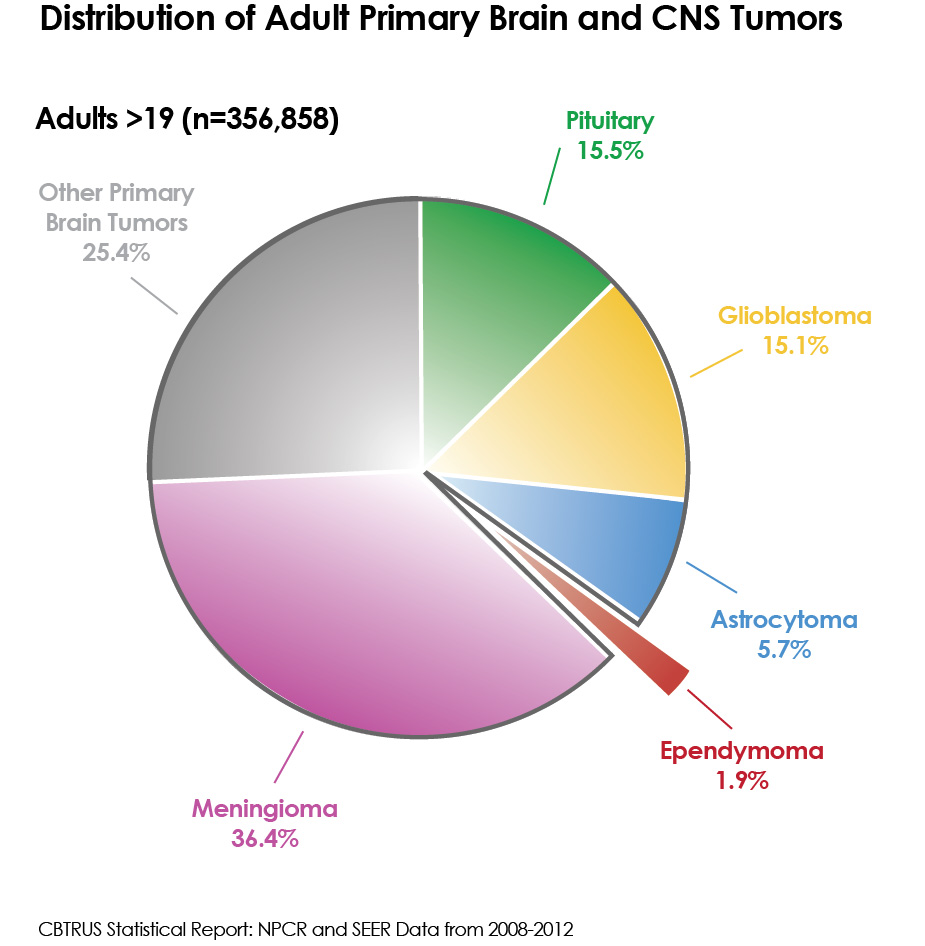
In adults 20+ years, ependymomas accounted for 1.9% of all tumors diagnosed. Approximately 1,100 adults are diagnosed with ependymoma per year.
Ependymomas / anaplastic ependymomas occur with similar incidence in males and females. The incidence of ependymoma variants is higher in males than females. The incidence of both ependymomas / anaplastic ependymomas and ependymoma variants was higher in whites than blacks.
Children (aged 0-19 years):
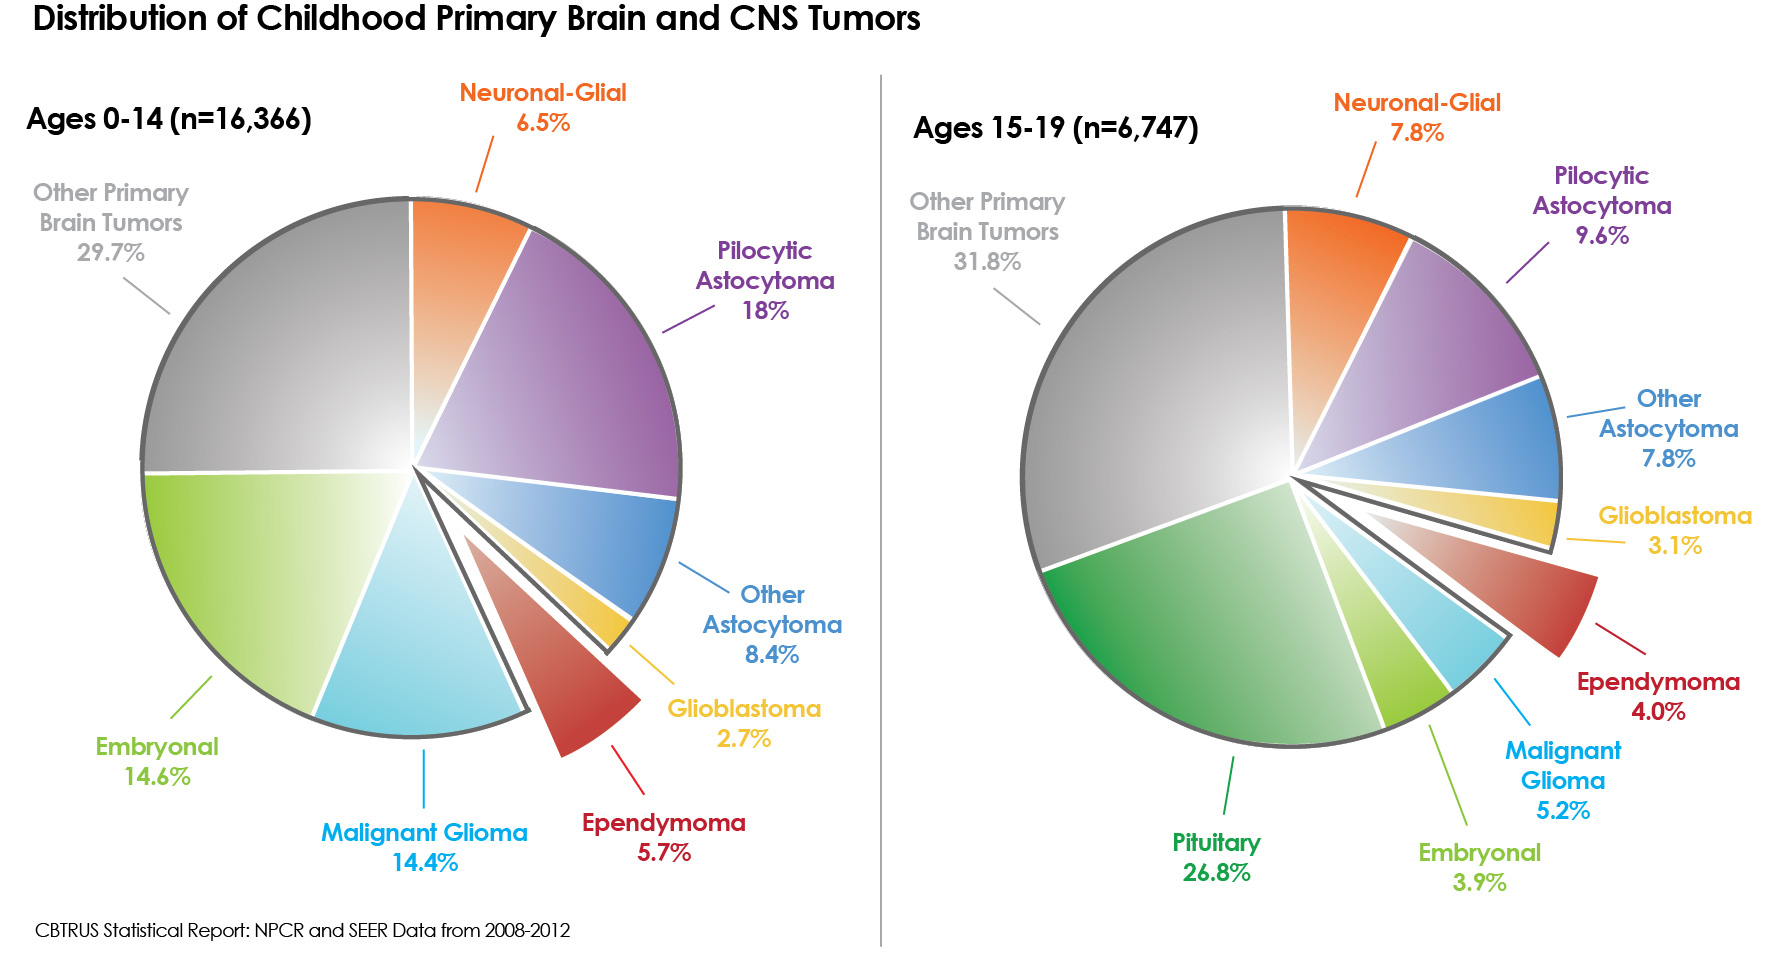
In children aged 0-14 years, ependymomas accounted for 5.7% of all tumors diagnosed. Approximately 185 children are diagnosed with ependymoma per year.
In children aged 15-19 years, ependymoma accounted for 4% of all tumors diagnosed. Approximately 50 teenagers are diagnosed with ependymoma per year.
The incidence of ependymomas/anaplastic ependymomas in children (aged 0-19 years) was similar in males and females. The incidence of ependymoma variants is higher in males than females.
Spinal Cord Tumors
For tumors involving the spinal cord, spinal meninges and cauda equina, ependymomas accounted for 20.5% of all tumors diagnosed in adults aged 20+ years and 21.6% of all tumors diagnosed in children aged 0-19 years. Approximately 690 people are diagnosed with spinal cord ependymoma per year.
Prevalence of Primary Brain or CNS Tumors
The prevalence rate of primary brain and central nervous system tumors was estimated that 688,000 persons in the U. S. were living with a diagnosis of primary brain and CNS tumors in 2010.
For children (aged 0-19 years), the prevalence rate for all pediatric primary brain and central nervous system tumors was estimated that 28,000 children were living with one of these diagnoses in the U.S. in 2010.
5-year Survival Rates for All Primary Brain or CNS Tumors
The 5-year relative survival rate for all primary brain and central nervous system tumors is 34.4%. For children aged 0-19 years, the 5-year relative survival rate is 73.6%.
5-year Survival Rates for Ependymomas
For those with ependymoma, the overall 5-year relative survival rate is 83.4%. 5-year relative survival rates are highest for those aged 20-44 years (91%), and decrease with increasing age at diagnosis with a 5-year relative survival rate of 57.8% for those aged 75+ years. For children aged 0-19, the 5-year relative survival rate is 75.2%.
Please recognize that these numbers are helpful for general information related to ependymoma, but may not be meaningful for any one individual. Please discuss any questions or concerns that you have about your own diagnosis with your treating physician.
Created June, 2010. Revised August, 2016. Special thanks to Terri Armstrong, PhD; Carol Kruchko; Bridget McCarthy, PhD; and Therese Dolecek, PhD.